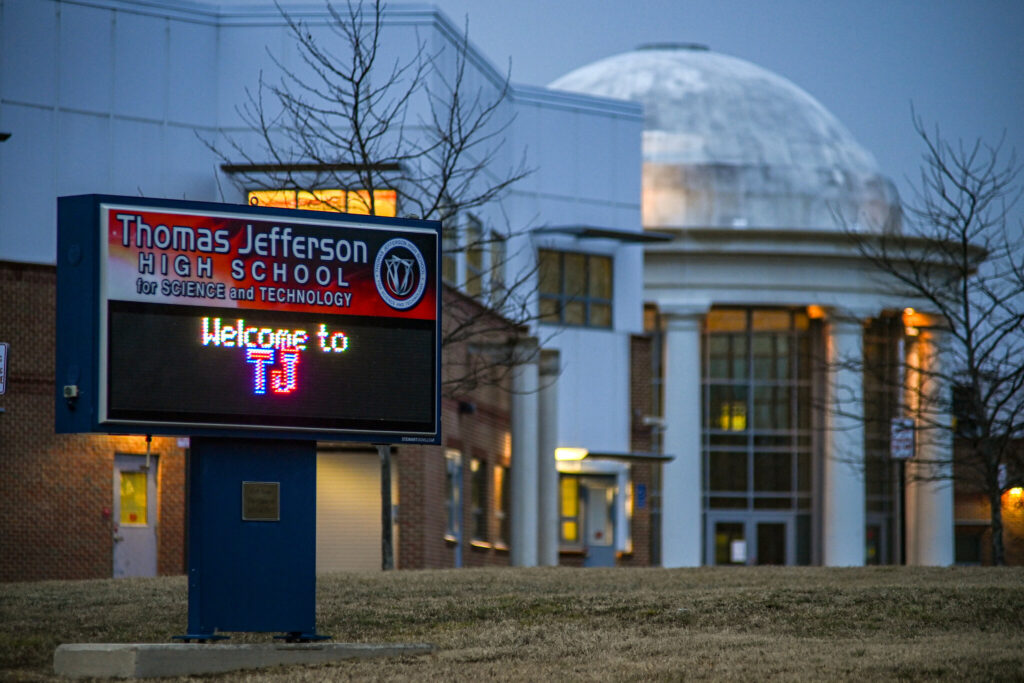
Thomas Jefferson High School for Science and Technology demographics show how the best school in the United States is composed.
Here, I will be detailing the complete composition of Thomas Jefferson high for science and technology school demographics. Remember every child with a passion for a STEM-focused school wants to be in this school.
The school has been ranked number 1 in the national rankings, Virginia High Schools, Washington, DC Metro Area High Schools, Fairfax County Public Schools High Schools, Magnet High Schools, and just 6th in STEM High Schools.
As a result of such an impressive performance in academia, a lot of parents with an eye for top-notch education for their ward would want their child here hence Thomas Jefferson high school for science and technology demographics is needed to evaluate your chances.
But what do the demographics look like when the school’s acceptance rate is 26.1% for 2022? Keep reading as we find out the details

When we talk about the demographics of a school, we simply look into the composition of the school’s population in terms of student diversity (minority enrollment), and gender distribution among other things.
Thomas Jefferson high school for science and technology demographics
According to usnews.com, the student diversity ratio of Thomas Jefferson high for science and technology school for science and technology is 81.7%.
That percentage of minority enrollment in the school is not quite balanced considering the under-representation of Black and Hispanic students.

As a result, the school has faced a lot of controversies in its admission process which ultimately produces the demographics of the students all through its history.
Let’s see the numbers involved in the demographics of the school;
Race and Ethnicity
The school currently has a total enrollment of 1,809 and below are the percentages of students per race and ethnicity;
- 18.3% – White
- 72.0% – Asian
- 4.8% – Two or More Races
- 3.0% – Hispanic
- 1.8% – Black
- 0.1% – American Indian/Alaska Native
- 0.1% – Native Hawaiian/Pacific Islander
Thomas Jefferson high school for science and technology demographics on race and ethnicity show a disparity between the admission rate of Blacks, Hispanics, American Indians/Alaska natives, and native Hawaiians/Pacific Islanders.
What is the percentage of males in Thomas Jefferson High School For Science And Technology?
Out of the 1,809 students in the school, 59% are male
This leaves the entire number of male students at a little over 1060.
What is the percentage of females in Thomas Jefferson high school for science and technology?
And out of the 1,809 students in the school, 41% – female
The number of females in the school per their percentage is also a little over 740.
The Thomas Jefferson high school for science and technology demographics show that the school is largely dominated by Asian students who make up a whopping 72.0% of the entire student population.
